Investors may be considering alternatives to bolster their portfolio given the poor start for traditional investments in 2022. Private equity funds in particular have the potential to offer higher returns than their publicly traded counterparts.1 Although private companies are certainly not immune to economic downturns, the current environment may present a silver lining for private equity managers: the opportunity to deploy capital at cheaper valuations.
While effective manager selection and vintage diversification remain important, investors considering private equity may also seek to take into consideration the nuances of fund timing in relation to the market environment. Our deep dive into the historical relationship between public market valuations and private equity fund vintages appears to confirm that entry point did in fact have a meaningful impact on vintage performance. In line with our intuition, deploying capital in cheaper valuation environments tended to lead to higher performing vintages than in richer investment environments. If this historical relationship holds, the current environment—which has seen a collapse of public equity market multiples in the face of high inflation, rising interest rates and economic uncertainty—may be a similarly attractive entry point.
The Nature of Private Equity Investing
When investing in private equity, fund managers typically use drawdown vehicles, which by design have finite life cycles. In contrast, traditional public equity fund vehicles are often “evergreen,” which means investors can buy into or sell out of what are typically fully invested funds at any point. This difference may highlight a timing risk for private equity investing.
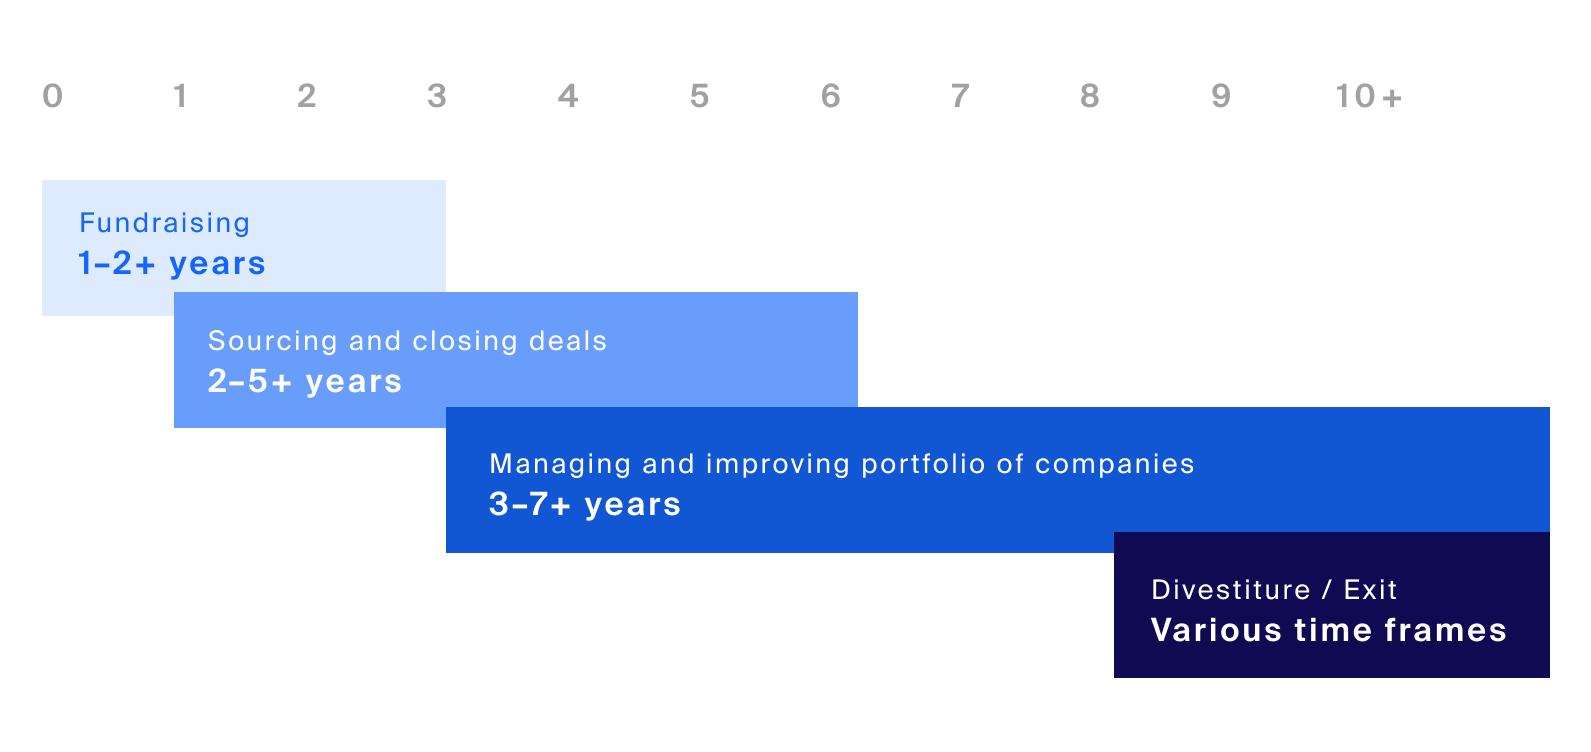
In the drawdown structure, funds are raised in a collective vehicle. The private equity manager typically deploys these funds within the first 2-5 years, i.e. the “investment period.” Over the course of the fund’s life, the manager will seek to improve their portfolio companies. In the latter stage of a fund’s life, the fund manager seeks to exit those portfolio companies and return cash to investors, ideally at a multiple above what they originally paid in (Exhibit 1).
Source: The DVS Group
In the latter stage of a fund’s life, the fund manager seeks to exit those portfolio companies and return cash to investors, ideally at a multiple above what they originally paid in.
The return of a private equity fund thus generally depends on the difference between the price at which the portfolio companies are acquired in years 1-4 and sold in years 9-11+. The skill of a private equity fund manager in selecting companies, negotiating acquisition price, improving company value and optimizing portfolio company exits can play a large part in the ultimate performance of a given fund. An ideal deployment environment would typically be one in which companies can be acquired at a relatively lower valuation, measurable by assessing the price paid for every dollar of earnings, cash flow, or revenue, while an ideal exit environment would be one in which the price paid is relatively higher. However, the market environment in which they are deploying capital, and even less so the environment in which they are exiting, are typically outside of the fund manager’s control.
This lack of control over timing and its perceived ultimate effect on performance gave birth to the concept of “vintage years,” which refers to the year in which a fund makes its first investment. To mitigate this inherent timing risk, investors may consider constructing a private equity allocation that layers across multiple vintages. In doing so, investors have a chance to diversify exposure to multiple unpredictable market environments.
The Potential Impact of Entry Point on Private Equity Vintage Performance
While the valuation environment in which a private equity fund exits is all but impossible to project, the environment in which a fund deploys capital may be more perceptible and therefore worthy of closer examination.
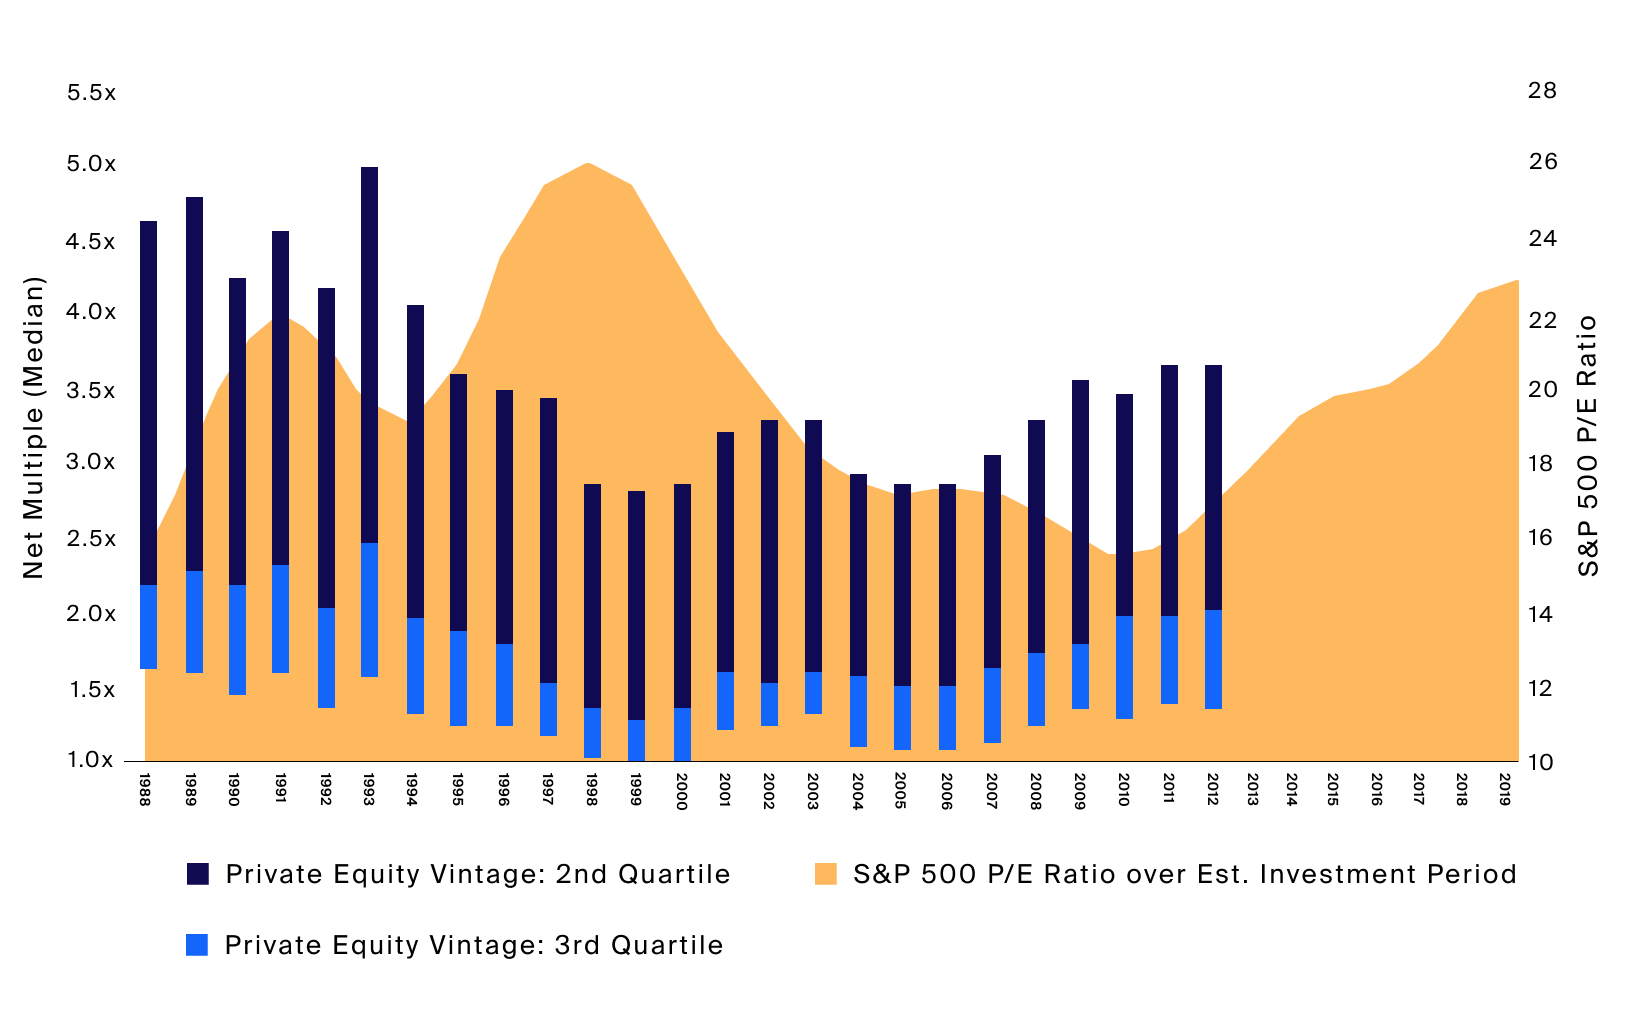
The chart below (Exhibit 2) compares the ultimate performance, measured in net multiples of paid-in capital, of “mature” vintages (10+ years from the first investment). Within each vintage, we show the range of net returns generated by 2nd and 3rd quartile funds of that vintage; the point at which the 2nd and 3rd quartile bars meet is the net return of the median fund of that given vintage. This performance is layered over the market environment in which funds in each vintage deployed capital—illustrated as the orange backdrop with the average Price to Earnings ratio (P/E) of the Standard &Poor’s 500 index over the investment period of funds in that given vintage. The S&P 500 price multiple, a marker of public equity market valuation, is utilized to provide a more granular and timely visualization since private market valuations report infrequently and with a lag.
Source: Bloomberg, S&P 500 Average P/E over Est. Investment Period represented by the average of the Price to Earnings Ratio of the SPX Index over years 0-3 of the vintage year, Preqin, Private Equity Vintage: 2nd and 3rd Quartiles determined by the Preqin Private Equity-All vintage year benchmark Top Quartile Boundary (Q1), Median and the Bottom Quartile Boundary (Q3) Net Multiples as of 7/31/2022.
The chart compares the ultimate performance, measured in net multiples of paid-in capital, of “mature” vintages (10+ years from the first investment). Within each vintage, we show the range of net returns generated by 2nd and 3rd quartile funds of that vintage; the point at which the 2nd and 3rd quartile bars meet is the net return of the median fund of that given vintage. This performance is layered over the market environment in which funds in each vintage deployed capital—illustrated as the orange backdrop with the average Price to Earnings ratio (P/E) of the Standard &Poor’s 500 index over the investment period of funds in that given vintage. The S&P 500 price multiple, a marker of public equity market valuation, is utilized to provide a more granular and timely visualization since private market valuations report infrequently and with a lag.
A key observation here is that funds that invested in periods where public market multiples were lower tended to outperform those that deployed capital in valuation-rich environments.
Consider the relative underperformance of private equity funds with vintages from 1998-2000, which deployed capital into the peak of the dot-com bubble, compared to those with vintages from 2001-2003, which were able to invest in companies at lower, if not depressed, valuations after the associated crash. The same story appears true for funds in vintages 2004-2006, which deployed capital before the Global Financial Crisis (GFC). These vintages tended to underperform funds that deployed capital post-GFC (Exhibit 3).
Vintages which have yet to reach 10 years (2013 and beyond) have been excluded since they have yet to reach maturity. However, the rising P/E backdrop of their investment periods suggests funds in those vintages, all else equal, may be more challenged in generating the returns of their predecessors.
Source: S&P 500 Average P/E over Est. Investment Period represented by the average of the Price to Earnings Ratio of the SPX Index over years 0-3 of the vintage year, recession periods determined by USRINDEX Index, Preqin, Net Multiple (Median) by the Preqin Private Equity-All vintage year benchmark Median Net Multiple as of 7/31/2022.
Consider the relative underperformance of private equity funds with vintages from 1998-2000, which deployed capital into the peak of the dot-com bubble, compared to those with vintages from 2001-2003, which were able to invest in companies at lower, if not depressed, valuations after the associated crash. The same story appears true for funds in vintages 2004-2006, which deployed capital before the Global Financial Crisis (GFC). These vintages tended to underperform funds that deployed capital post-GFC.
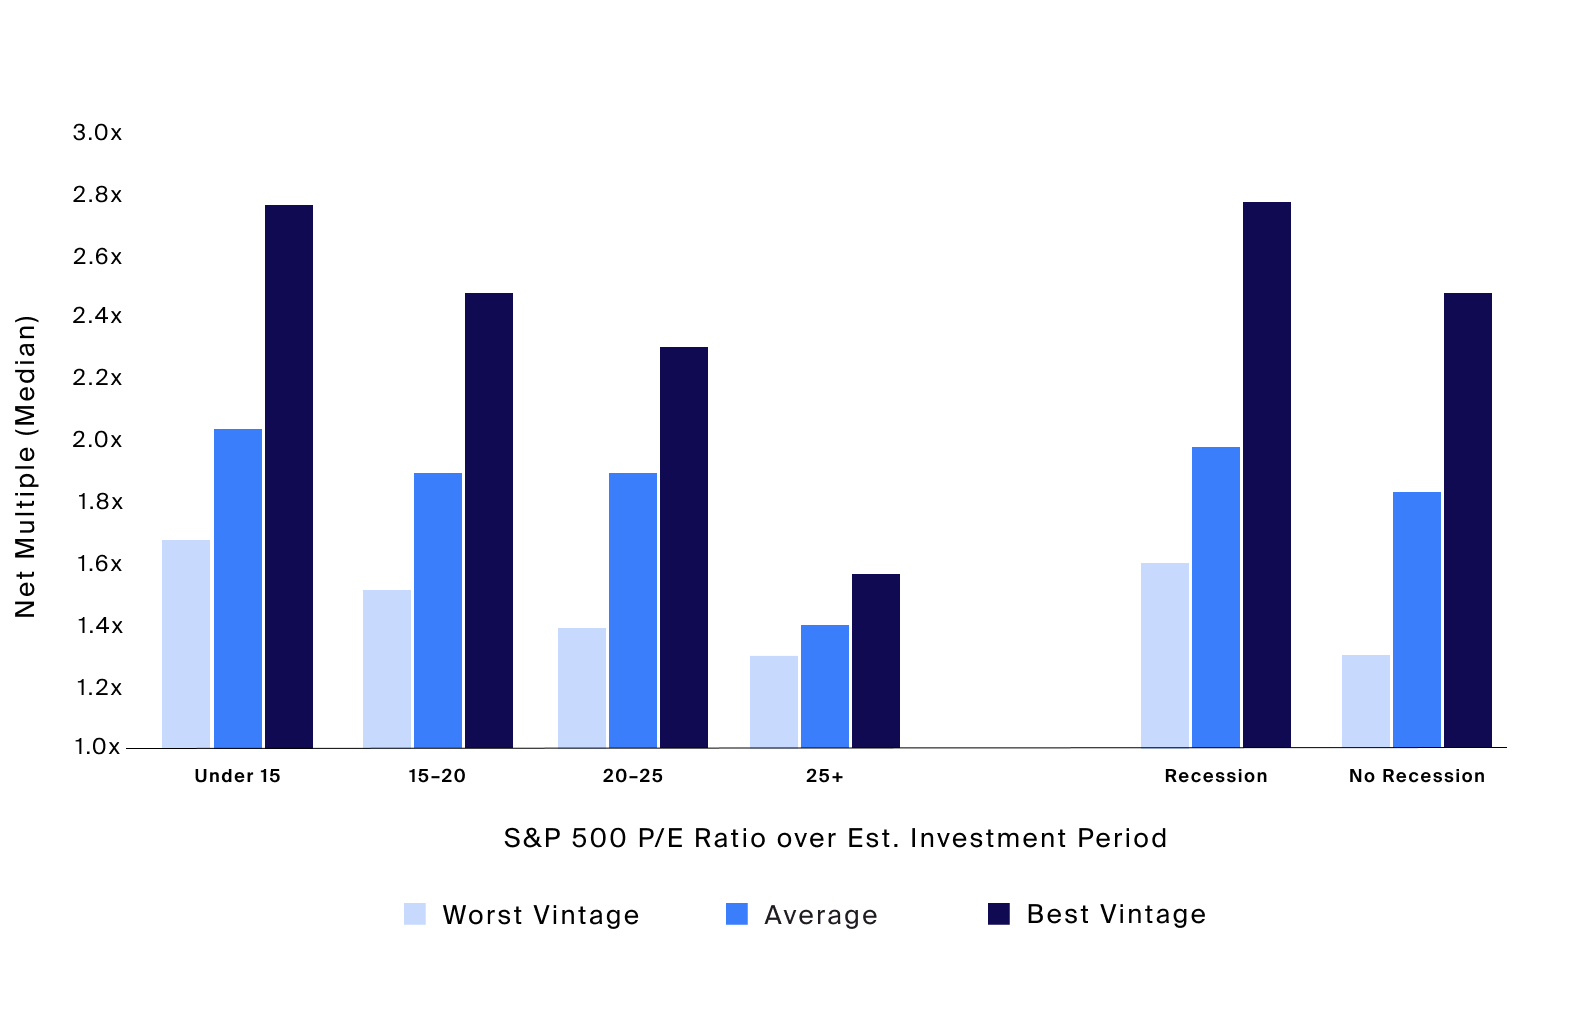
In the graph above, vintages are grouped by the richness of valuation environments during capital deployment, again measured by the average S&P 500 P/E ratio during their approximate investment periods.
A trend appears to emerge: vintages, as measured by their median net multiple, that deployed capital in cheaper valuation environments tended to outperform vintages that deployed capital in richer valuation environments. For example, the worst-performing vintage of those that invested in an average 15 or below P/E ratio environment still outperformed the best-performing vintage of those that invested in an environment with an average 25 or above P/E ratio.
This directional pattern persists when analyzing recessionary vs. non-recessionary periods: vintages that deployed capital during recessionary environments typically outperformed those whose entry points were in non-recessionary environments.
Public vs. Private Market Valuations and the Current Environment
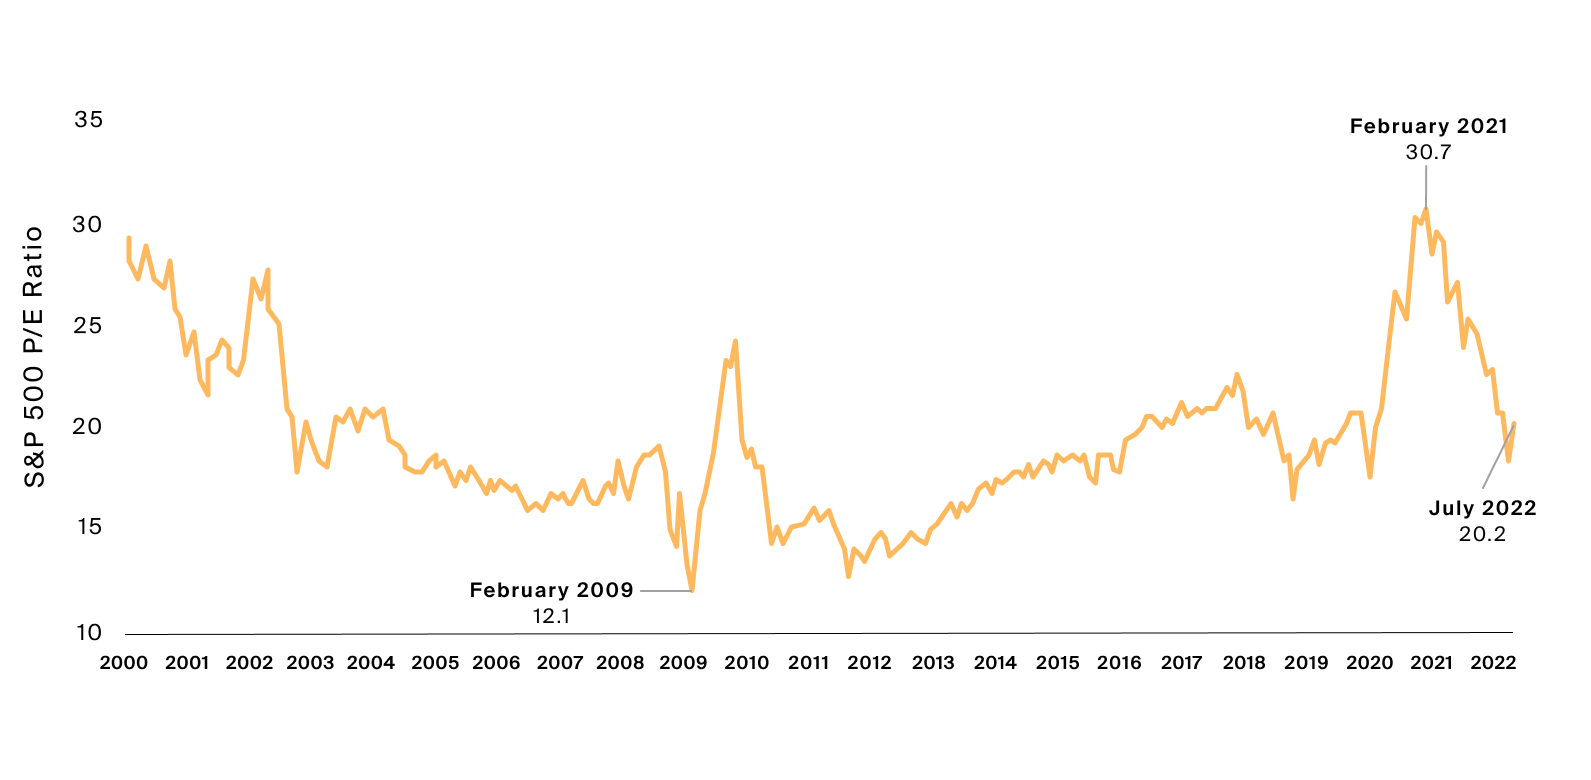
Changes to the S&P 500 P/E ratio reflect investor sentiment and are affected by many factors, such as the rate of expected growth in earnings of those publicly traded companies, the certainty of that earnings growth, interest rates or the opportunity cost of investing in public equities as opposed to traditional fixed income, and inflation rate expectations. In the end, the P/E ratio typically reflects how much public equity investors are willing to pay for a dollar of earnings (Exhibit 4).
Source: Bloomberg, S&P 500 Price to Earnings Ratio represented by the SPX Index, as of 7/31/2022.
Private market multiples tend to trail public market multiples. For example, consider that the P/E ratio bottom for the S&P 500 in the Global Financial Crisis came in February 2009.
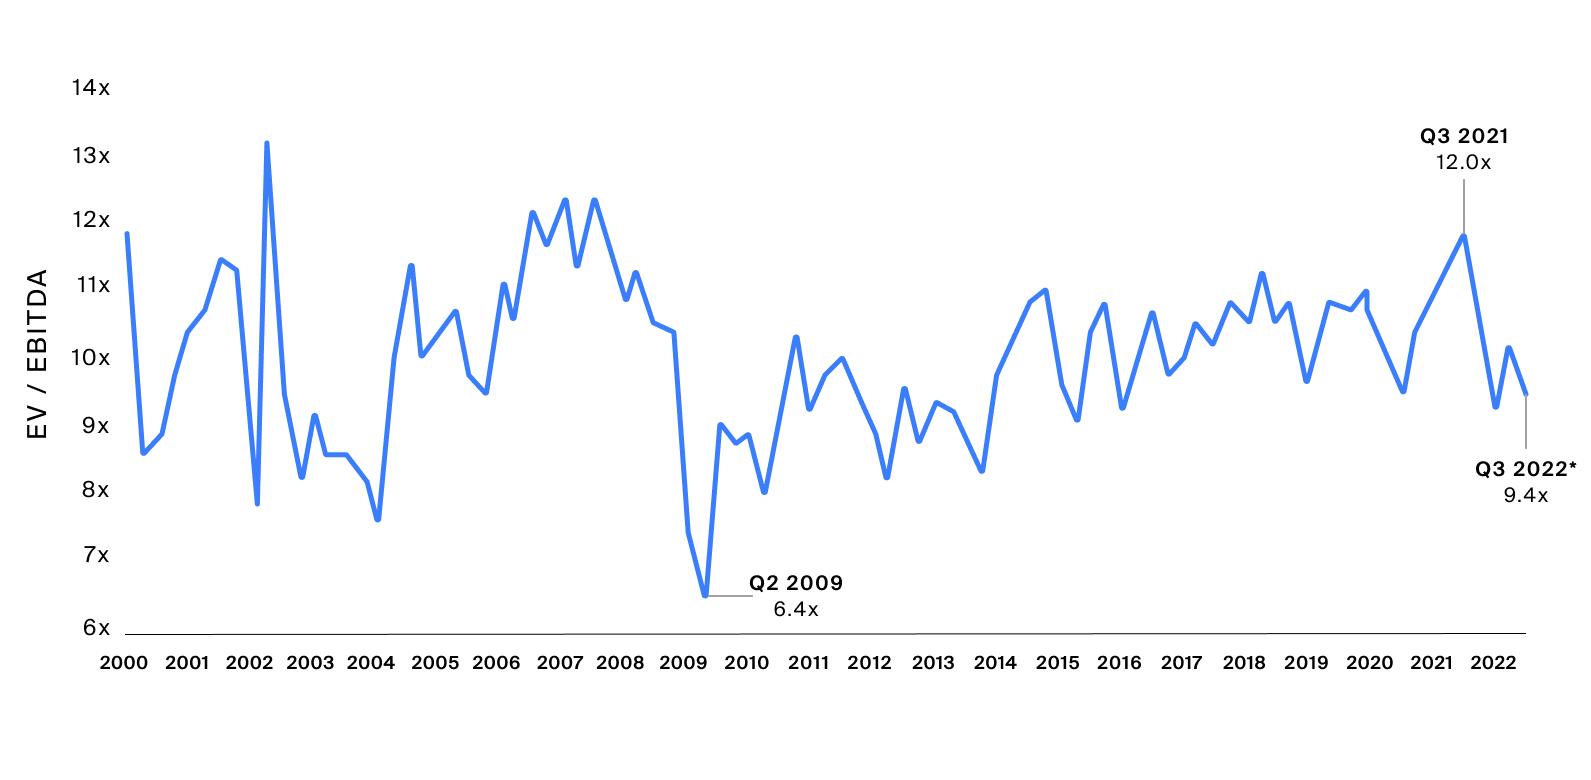
Private market deal multiples as measured by the Implied Enterprise Value to Earnings Before Interest, Taxes, Depreciation and Amortization (EV / EBITDA) ratio of completed deals, similarly indicate how much a private equity manager paid for every dollar of cash flow, for which EBITDA is a loose proxy.
Private market multiples tend to trail public market multiples. For example, consider that the P/E ratio bottom for the S&P 500 in the Global Financial Crisis came in February 2009 (Exhibit 4) while the private market multiple compression did not bottom until the following quarter, in Q2 2009 (Exhibit 5). Similarly, the latest top for public market multiples was in February 2021, whereas the recent high for private market multiples came later in Q3 of that year.
Source: Pitchbook, Implied EV/EBITDA Median of Completed Deals for All Buyout as of 8/12/2022.
Private market multiples tend to trail public market multiples. For example, consider that the P/E ratio bottom for the S&P 500 in the Global Financial Crisis came in February 2009 while the private market multiple compression did not bottom until the following quarter, in Q2 2009.
Since their peak in February 2021, public market multiples have come down substantially due to a number of factors, including but not limited to, persistently high inflation, rising interest rates and growing economic uncertainty, and now trade closer to the long-run average of 18.2. Private market valuations have already begun to compress as expected, with the median price for deals completed so far in Q3 2022 at 9.4x EV/EBITDA compared to a recent peak of 12.0x in Q3 2021.
If private market multiples continue to follow public market valuations, the current environment may be an attractive entry point for private fund managers to deploy capital. And as indicated through the historical analysis, if the current valuation environment persists, current and subsequent vintages may have the potential to generate greater returns compared to vintages investing into a relatively richer valuation environment.
Additional Considerations
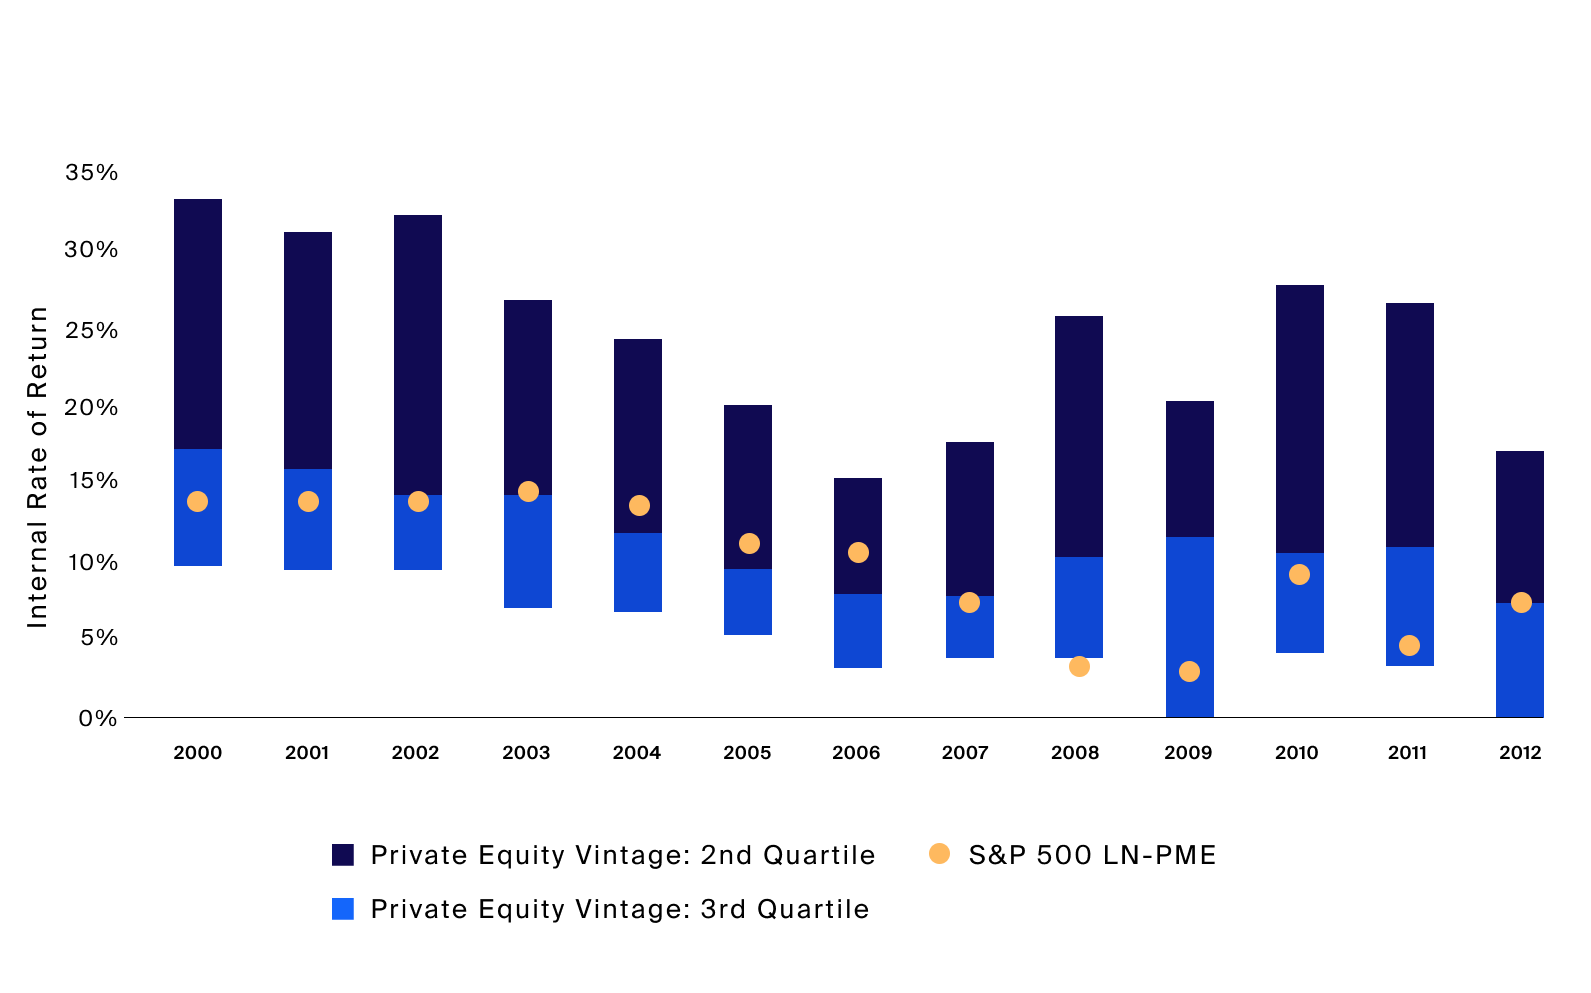
It is important to note that even private equity funds with vintage years in rich valuation environments in many cases tended to outperform an equivalent return from investment into the S&P 500 index, as estimated by the S&P 500 Long-Nickels Public Market Equivalent (LN-PME). All top-quartile private equity funds outperformed a S&P 500 PME in the mature private equity vintages, reinforcing the importance of manager selection (Exhibit 6). In particularly strong vintages like 2008 and 2009, more than 75% of managers outperformed a S&P 500 PME.
Source: Preqin, Net Multiple (Median) by the Preqin Private Equity-All vintage year benchmark Median Net Multiple as of 7/31/2022.
It is important to note that even private equity funds with vintage years in rich valuation environments in many cases tended to outperform an equivalent return from investment into the S&P 500 index, as estimated by the S&P 500 Long-Nickels Public Market Equivalent (LN-PME). All top-quartile private equity funds outperformed a S&P 500 PME in the mature private equity vintages, reinforcing the importance of manager selection.
Investors should also consider the risks of investing in private equity which include but are not limited to operational risk, liquidity risk, and market risk inherent to the nature of investing in private companies through an illiquid and long-term fund structure managed by a third-party.
While only one of many potential drivers for private market returns, a potentially attractive valuation environment may persist for private capital deployment as recession risks appear to rise and the Fed has signaled it may continue to hike rates in the face of persistently high inflation. Advisors may consider allocating to the private equity asset class and participating in current and subsequent private equity vintage years.


