The credit cycle may be in the early stages of a true and relatively more prolonged downturn, the likes of which we have not seen in decades. Even so, with its dual mandate of price stability and sustainable employment, the Federal Reserve has made apparent that it won’t likely step in to ameliorate this potential strain on the economy.1 For a while, it might even make it worse.
Unlike previous instances of credit dislocation after the Global Financial Crisis, during which a supportive Fed took steps to backstop, the current economic downturn may instead be exacerbated by a seemingly hawkish Fed still behind the curve on inflation.2
As much of the business community prepares to confront what’s anticipated to be a less forgiving environment, financial advisors likewise should aim to understand how the potential degree and duration of such a downturn may affect portfolios and their future opportunity set. In this piece — the first in our broader series on credit — we assess where we might be in the credit cycle by analyzing a broad swath of economic and financial market indicators. In our next installment of this series, we will investigate the evolution of credit markets and the expansion of leverage since the previous downturn and seek to understand where we may be headed and the factors that might make this credit downturn different from those in the easy money decade.
Phases of the Credit Market: Current Indications
Investors likely recognize that although navigating credit cycles remains more of an art than a science, it’s still worthwhile to conduct basic wayfinding when making investment decisions. Indeed, knowing where we are in a credit cycle may lead investors to better understand how and why the businesses they invest in behave. Credit cycles, however, can lack a clear and set definition; the best that many of us, including the Fed itself, can do is estimate based on a set of attributes that have been historically tied to each phase.
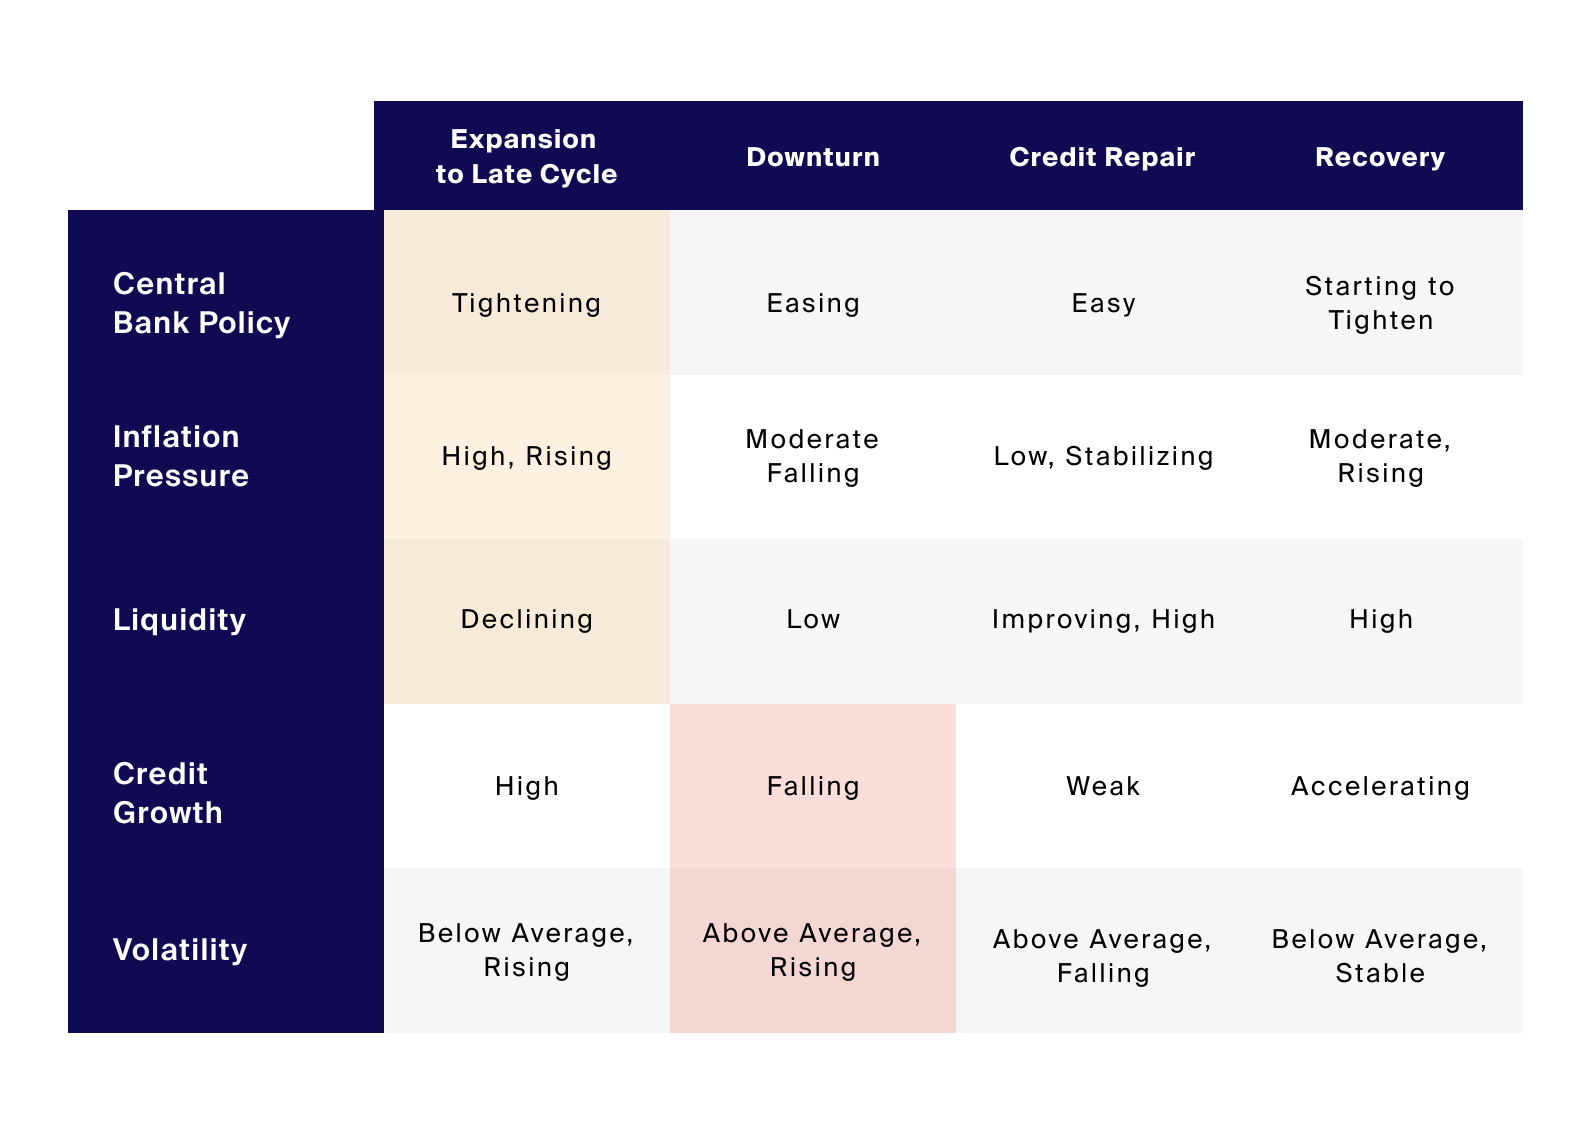
The table below (Exhibit 1) provides a basic overview of the conditions that typically occur during each phase of a credit cycle: expansion to late cycle, downturn, credit repair and recovery. We’ve identified where the latest economic and market data seem to position us and focus on a selection of attributes typically related to credit cycles, including central bank policy, inflation, liquidity, credit growth and volatility.
Source: Loomis Sayles, "Unlocking the Credit Cycle" – December 2019; Bloomberg, Central Bank Policy represented by Fed Funds Target Rate – Up with “Tightening” indicated by increasing values over most recent 12 month period, Inflation Pressure represented by US CPI Urban Consumers YoY NSA with "High" indicated by last value greater than long-term average and "Rising” indicated by increasing values over most recent 12 month period, Liquidity represented by US Govt Securities Liquidity Index with “Declining” indicated by increasing values over most recent 12 month period, and Volatility represented by the CBOE Volatility Index with “Above Average” indicated by last value greater than historical average and “Rising” indicated by increasing values over most recent 12 month period as of 9/30/2022; FRED St. Louis, Credit Growth represented by Bank Credit, All Commercial Banks with “Falling” indicated by decreasing rolling quarterly values over most recent 12 month period as of 9/30/2022.
The table below provides a basic overview of the conditions that typically occur during each phase of a credit cycle: expansion to late cycle, downturn, credit repair and recovery. We’ve identified where the latest economic and market data seem to position us and focus on a selection of attributes typically related to credit cycles, including central bank policy, inflation, liquidity, credit growth and volatility.
What May Be Driving the Credit Downturn?
Let’s start with inflation, which, as measured by core CPI, had been largely unresponsive to the easing of monetary policy in the decade after the GFC. Until April 2021, inflation never exceeded 2.5% in year-over-year growth but has since reached a record high that we’ve not seen since the Great Inflation era of the 1970s and early 1980s.3 Some market commentators have attributed recent heights in inflation to overly easy Fed policy, which potentially left rates too low for too long, overheating the economy.4 High and rising inflation are indications that the credit cycle is in a late-cycle stage, requiring central banks to tighten monetary policy, discourage borrowing and curb demand to regain price stability. While headline inflation appeared to peak in June, core inflation5 and sticky CPI have continued to accelerate.6
Next, let’s examine the policy of central banks, which are listed at the top of this table for a reason; after all, with their dominion over a country’s money supply, they possess some of the only levers that can intentionally attempt to move their economies through the phases. To date this year, most central banks globally have embarked on tightening monetary policy.7 The Fed, for instance, has hiked rates at the fastest pace in nearly three decades to curb demand and regain price stability.8 Despite starting at an effective rate of 0.08% in February 2022,9 the median Fed target rate is projected to reach the 4.4% range by the end of this year and end 2023 at 4.6%.10
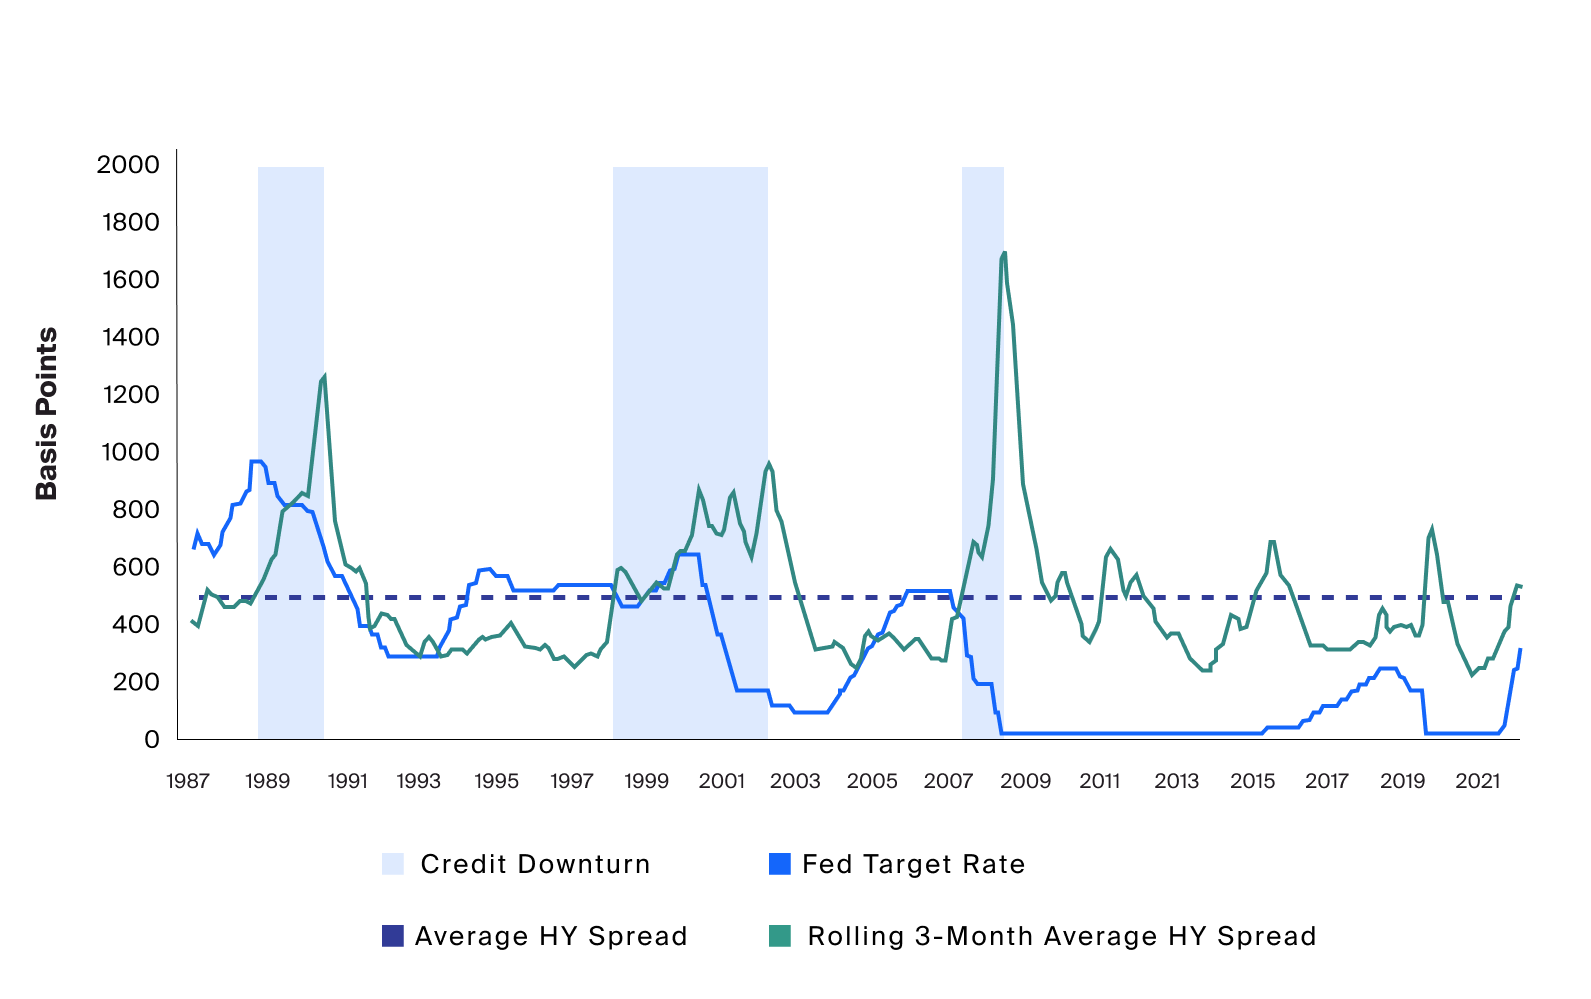
As intuition may suggest, central bank policy can have a direct hand in the direction of the credit cycle. Although not all rate hikes have led to an immediate or full credit downturn, the previous three credit cycle downturns have historically been preceded by Fed rate hikes and ended via rate cuts (Exhibit 2). The decade following the Global Financial Crisis has been characterized by a highly accommodative monetary environment, in which the Fed has maintained a near-zero target rate, and short-lived and relatively shallow credit events, marked by high-yield bond spreads exceeding their historical average of 500 basis points (Exhibit 2).
Source: Bloomberg, Credit Downturn represented by a rise in Rolling 3-Month Average HY Spread above the period average and a subsequent rise to 1000 Basis Points, Rolling 3-Month Average HY Spread represented by the 3-month rolling average of the BarCap US Corp HY YTW – 10 Year Spread, Fed Target Rate represented by Federal Reserve Target Rate, the Average HY Spread is represented by the period average of the BarCap US Corp HY YTW – 10 Year Spread, as of 9/30/2022.
As intuition may suggest, central bank policy can have a direct hand in the direction of the credit cycle. Although not all rate hikes have led to an immediate or full credit downturn, the previous three credit cycle downturns have historically been preceded by Fed rate hikes and ended via rate cuts. The decade following the Global Financial Crisis has been characterized by a highly accommodative monetary environment, in which the Fed has maintained a near-zero target rate, and short-lived and relatively shallow credit events, marked by high-yield bond spreads exceeding their historical average of 500 basis points.
If the Fed maintains course on its projected target rate, which does not peak until 2023,11 history suggests there are some ways to go before credit market stress, as measured by high-yield bond spreads, is alleviated.
A Potential End to the Easy Money Era
While parallels have been drawn to the Volcker era given the combination of persistently high inflation and the need for monetary tightening,12 the U.S. economy appears to have entered this high inflationary period from a position of strength — particularly as it relates to the labor market, which has stayed tight. This means the Fed may be able to (and may need to) continue rate hikes or keep interest rates higher for longer in its attempt to curb inflation before pivoting back to easing. Indeed, in Powell’s own words:
“We must keep at it until the job is done. History shows that the employment costs of bringing down inflation are likely to increase with delay, as high inflation becomes more entrenched in wage and price setting.
The successful Volcker disinflation in the early 1980s followed multiple failed attempts to lower inflation over the previous 15 years. A lengthy period of very restrictive monetary policy was ultimately needed to stem the high inflation and start the process of getting inflation down to the low and stable levels that were the norm until the spring of last year. Our aim is to avoid that outcome by acting with resolve now.”13
Such a statement suggests that the central bank “put” that backstopped financial markets and led the economy and markets out of credit downturns for decades should not be counted upon. In fact, the opposite – a Fed “call” – may be in play, which suggests continued Fed tightening or a lack of cutting would sustain a downturn and potentially prevent a credit, market and economic recovery until the Fed believes price stability has been regained.14
Access to Credit and Liquidity Declining as the Fed Steps Back
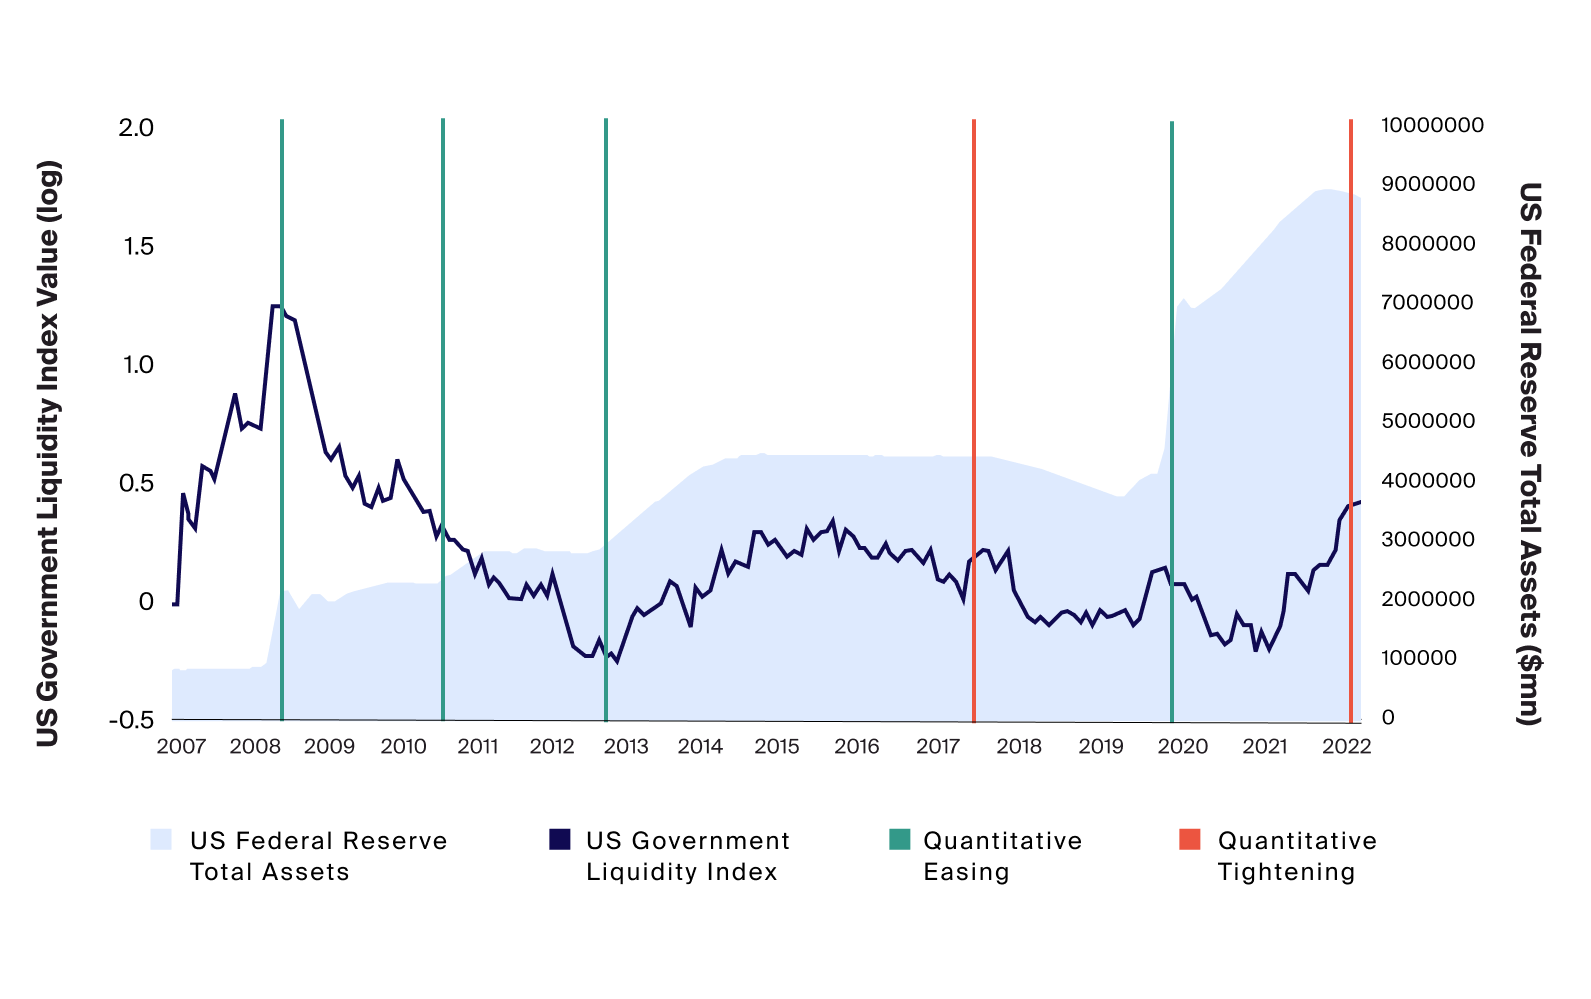
The Treasury market, considered “the deepest and most liquid fixed-income market in the world,” is critical in that it serves as a benchmark for other dollar-based fixed income markets, like the corporate bond, mortgage, consumer credit and loan markets.15 The Federal Reserve has in the past decade purchased large quantities of U.S. Treasuries (and mortgage-backed securities) to provide additional stimulus to the economy by stabilizing and providing liquidity to the all-important Treasury market in times of stress, in particular during the Great Recession and the COVID-19 crisis.16 In conducting this quantitative easing program, the Fed expanded its balance sheet from $900 billion in July 2008 to $4 trillion in early 2020 and then doubled that over the course of two years to nearly $9 trillion at its peak in April 2022 (Exhibit 3).
Source: Board of Governors of the Federal Reserve System (US), US Federal Reserve Total Assets represented by Total Assets (Less Eliminations from Consolidation); Bloomberg, U.S. Government Liquidity Index represented by U.S. Govt Securities Liquidity I, Instances of Quantitative Tightening and Easing represented in chronology by Yardeni Research, as of 9/30/2022.
In conducting this quantitative easing program, the Fed expanded its balance sheet from $900 billion in July 2008 to $4 trillion in early 2020 and then doubled that over the course of two years to nearly $9 trillion at its peak in April 2022.
As the Fed reverses course and shifts back to shrinking its balance sheet after a failed attempt in 2019, liquidity has resurfaced as a potential issue for the Treasury market. Volatility has been exacerbated by many factors, including uncertainty over inflation, the Russian-Ukraine war, and a motley crew of other exogenous disruptors. As we show above in Exhibit 3, a lack of Fed support in this crucial market may mean liquidity conditions could worsen beyond current levels – which already appear to have reached the 2020 pandemic sell-off levels. Worsening liquidity in the Treasury market and the subsequent price volatility could spill over to other credit markets.
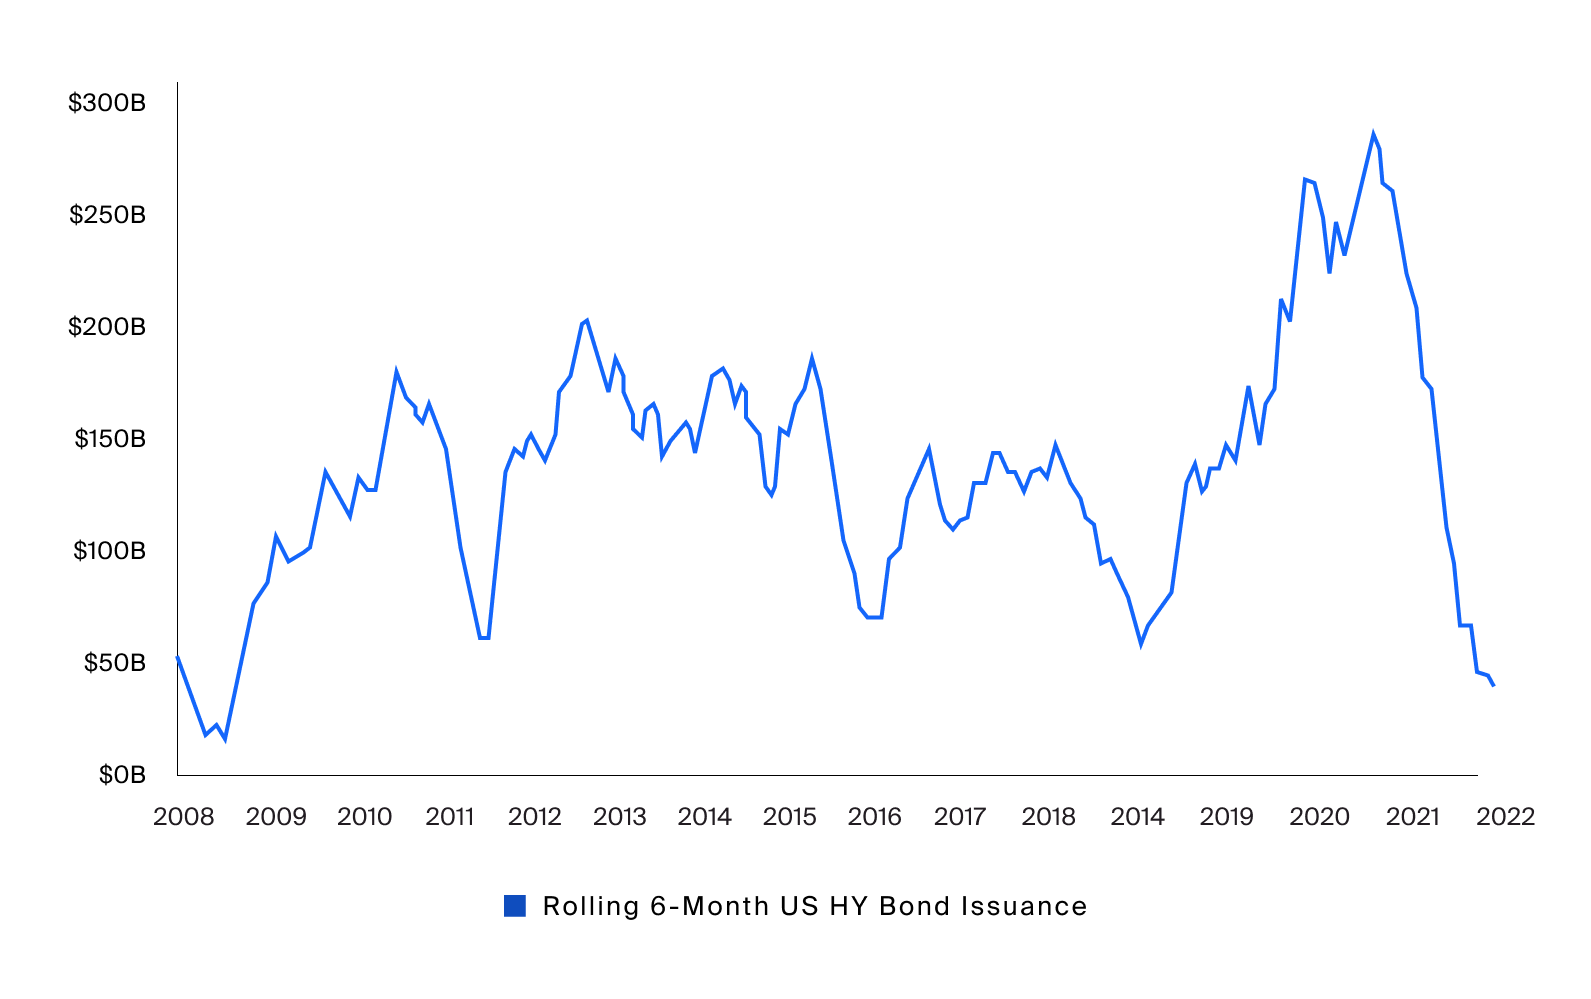
Higher interest rates and the heightened risk of recession have also already begun to contribute to falling credit growth in the first half of 2022. U.S. high-yield bond issuance and institutional leveraged loan issuance have both fallen drastically, by 78% and 60% respectively, compared to the same time last year, underlining potential difficulties for firms to access liquidity to refinance debt obligations in this new environment.17 The last slowdown of this magnitude was during the GFC, when high-yield and leveraged-loan issuance volume fell 63% and 83% respectively from 2007 to 2008 18 From the consumer credit perspective, homebuyers’ demand for mortgages, which makes up the majority of household debt ,19 has fallen by nearly a third since last year with the 30-year fixed mortgage rate rising above 6%, again for the first time since 2008.20
Source: Leveraged Commentary & Data (LCD); Pitchbook, “As borrowing costs rise, high-yield bond issuance plummets in Q3”, 9/26/22.
Higher interest rates and the heightened risk of recession have also already begun to contribute to falling credit growth in the first half of 2022. U.S. high-yield bond issuance and institutional leveraged loan issuance have both fallen drastically, by 78% and 60% respectively, compared to the same time last year, underlining potential difficulties for firms to access liquidity to refinance debt obligations in this new environment
Potential Implications for the Business Cycle and the Broader Economy
Based on the data we present above, we believe that we’re now facing a genuine and potentially lengthy credit downturn, one that differs notably from the shorter-lived, event-driven credit dislocations from the past decade. We’re already seeing the effects in the global economy. For example, the OECD recently downgraded their 2023 global GDP forecasts by roughly $2.8 trillion from their December 2021 estimates, putting the global GDP growth rate at only 2.2% in 2023. We’re also seeing reverberations within the business community as corporate profit growth appears to be slowing, as earnings are increasingly impacted by higher financing costs.21 Together, these new and relatively weak conditions may bring about a fresh set of risks and opportunities that investors in the recent era have yet to consider. In an upcoming piece, we will explore the implications of this less forgiving environment for companies and the size of the potential opportunity set for credit investors.


