When an advisor is deciding whether to include an alternative asset class in their client portfolios, they typically compare performance at an index level. Yet, when their process moves from portfolio construction to actual implementation, those same aggregate indices may not be readily accessible through an investable fund, like an S&P500 ETF for US Large Cap equities, for example.
Instead, financial advisors may decide to pursue an asset manager, strategy and/or fund to add the exposure they seek through their alternative asset allocation. That fund’s performance may potentially be markedly different than its index.1
To better understand the importance of selecting managers, we look at the difference in historical fund performance across alternative asset classes and through different market environments. We also investigated the extent that asset managers’ past performance might effectively guide advisors in their due diligence efforts. Given our findings, we believe that careful diligence of managers is critical when pursuing the risks and potential benefits of alternative assets.
Manager research may be even more important when selecting private markets strategies that typically target higher relative returns, like venture capital. Even lower-return-targeting alternative strategies may require this extra attention compared to active traditional strategies, as dispersion of fund performance appears to vary over time and may be exacerbated in certain market environments. Finally, assessing a private fund solely based on a previous fund’s performance relative to its peers has proven to be an insufficient measure given the lack of meaningful persistence of performance.
What is Dispersion in Performance?
Dispersion signifies the variability or spread of returns. Put another way, it examines the differences in the returns between funds that belong to the same asset class or strategy
Fund performance can vary even within the same asset class or strategy due to differing market environment at entry and exit points of fund investments, differing exposures due to underlying fund investments, and different approaches by fund managers in their attempt to drive value.
In many cases, portfolio managers use active management strategies where they make specific investments with the aim of outperforming the market—thus, leading to varied dispersion levels among different investment products.
How Fund Performance Dispersion May Differ Across Asset Classes
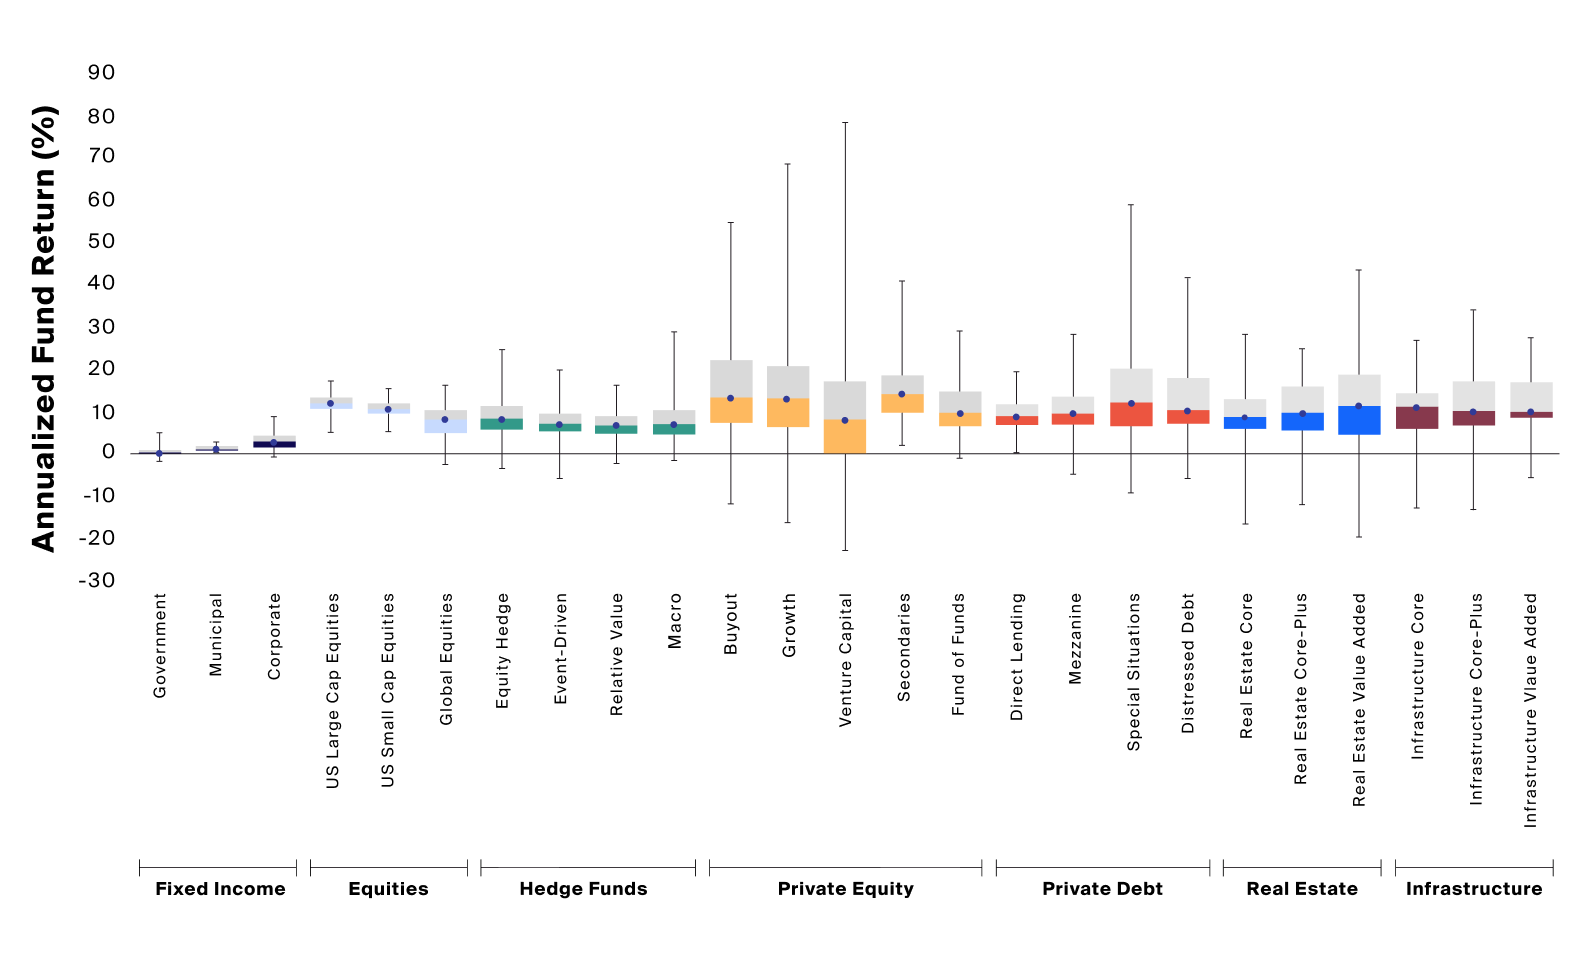
Higher dispersion in fund performance within asset classes may present both heightened risk and opportunity. Take venture capital, which had the highest dispersion in fund returns among the asset classes we analyzed (Exhibit 1) due to its higher-risk strategy of investing in the equity of earlier-stage companies.2 The experience of a venture capital fund investor would have been different depending on the quartile of the fund in which they invested: while the median fund generated an internal rate of return (IRR) of 8.2%, the top quartile of funds generated an IRR between 17.0% and 79.0%. Most investors in bottom quartile funds, meanwhile, experienced a loss of capital, with an IRR between 0.3% and -22.4%.
Keep in mind that performance and target returns are reported differently across asset classes. At the end of this piece, we include some considerations regarding the data we use in our analysis.
Source: Fund data trimmed by removing funds in the 2.5% return tails of each asset class depicted. Analysis is based on the remaining 95% of funds, capturing approximately 2 standard deviations from the median, assuming a normal distribution of fund returns. HFR, Constituents of the HFRI Composite measured by Rate of Return since 1990 and consists of Macro, Relative Value, Equity Hedge, and Event Driven. Preqin, Private Equity data represented by mature funds (minimum 10 years) and consists of Buyout, Venture, Growth, Fund of Funds and Secondaries (minimum 7 years); Private Debt data represented by mature funds (minimum 3 years) consists of Direct Lending, Mezzanine, Special Situations and Distressed Debt; Real Estate, data represented by mature funds (minimum 10 years ) consists of Core, Core-Plus, Value-Added; Infrastructure data represented by mature funds (minimum 10 years) consists of Core, Core-Plus and Value Added. All returns measured by internal rate of return (IRR)% since inception of funds analyzed. Bloomberg, Fixed Income funds represented by US focused open-end funds. US Equity funds represented by open end funds, Large-cap and Small-cap strategies, and Global Equity funds represented by broad focus market cap classified funds. Return data is representative of 10-year annualized total returns.
Fund selection may be impactful as the spread of performance outcomes for alternative strategies is higher than in traditional asset classes.
Private equity funds of funds, on the other hand, have historically shown a relatively lower dispersion of returns compared to the individual buyout, growth equity, and venture funds that they typically comprise. Therefore, investing in a fund of funds may reduce performance dispersion risk compared with allocating to a single fund or manager. Yet, while a fund-of-fund approach to private equity investing has led to more consistent outcomes than single-fund approaches, funds of funds also appeared to offer less potential upside.3
Source: Fund data trimmed by removing funds in the 2.5% return tails of each asset class depicted. Analysis is based on the remaining 95% of funds, capturing approximately 2 standard deviations from the median, assuming a normal distribution of fund returns. HFR, Constituents of the HFRI Composite measured by Rate of Return since 1990 and consists of Macro, Relative Value, Equity Hedge, and Event Driven. Preqin, Private Equity data represented by mature funds (minimum 10 years) and consists of Buyout, Venture, Growth, Fund of Funds and Secondaries (minimum 7 years); Private Debt data represented by mature funds (minimum 3 years) consists of Direct Lending, Mezzanine, Special Situations and Distressed Debt; Real Estate, data represented by mature funds (minimum 10 years ) consists of Core, Core-Plus, Value-Added; Infrastructure data represented by mature funds (minimum 10 years) consists of Core, Core-Plus and Value Added. All returns measured by internal rate of return (IRR)% since inception of funds analyzed. Bloomberg, Fixed Income funds represented by US focused open-end funds. US Equity funds represented by open end funds, Large-cap and Small-cap strategies, and Global Equity funds represented by broad focus market cap classified funds. Return data is representative of 10-year annualized total returns.
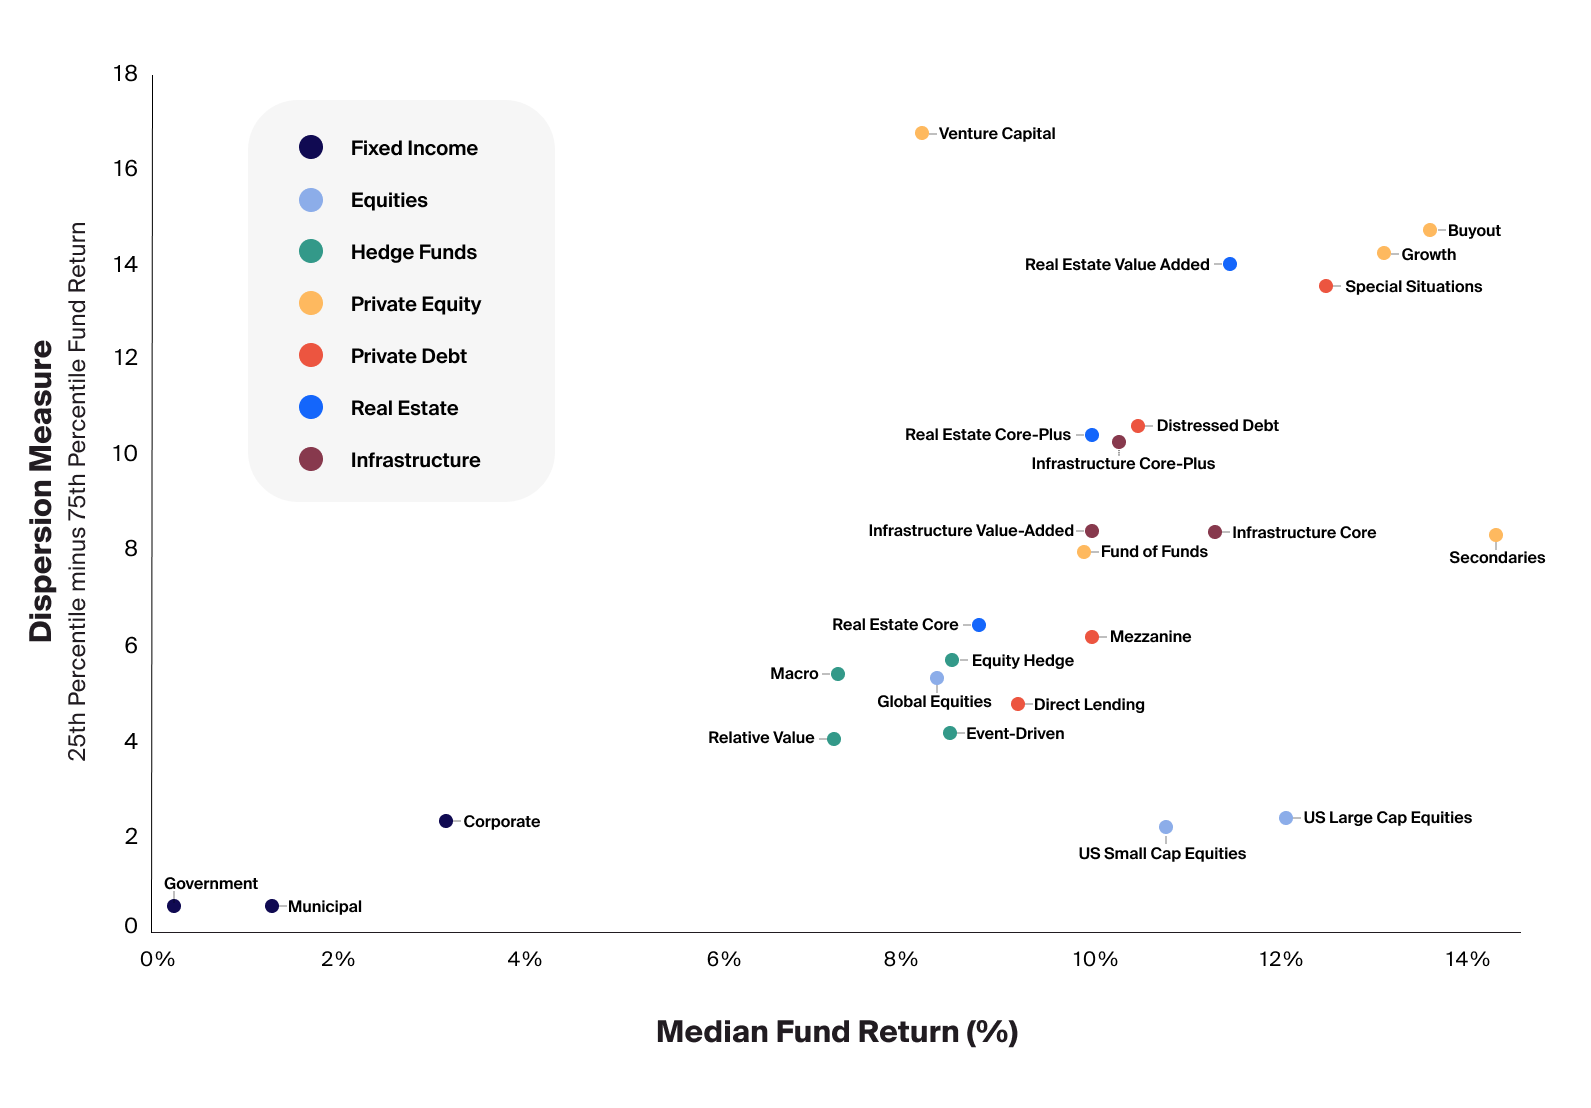
Variability in fund performance increases with higher-return-targeting strategies.
When mapping the median return of strategies against dispersion, as measured by the difference in return between the 25th percentile and 75th percentile funds, a pattern emerges. Asset classes with higher historical median returns, which also typically employed higher-risk strategies, had a wider range of performance outcomes at the fund level (Exhibit 2).
There were, however, some deviations from the trend. Venture capital, for example, exhibited an even higher dispersion of results relative to the trend given its median fund return (Exhibit 2). This seems to underline the importance of investing with the highest-quality managers in this asset class and potentially considering a multi-fund or fund-of-funds approach to mitigate the risk of a single manager or fund.
Secondaries funds, on the other hand, historically had a relatively low ratio of return dispersion to median return, which we analyzed in more detail in our deep dive on the evolution of the secondaries market.
How Fund Performance Dispersion May Differ Across Time
While manager selection can be important across market cycles and macro environments, there may be environments in which fund performance across different managers may vary even more greatly than a single end-point dispersion value would suggest. To explore this further, we focused on the dispersion of performance across hedge funds, represented by the constituents of the HFRI Fund Weighted Composite Index (HFRI).
Source: Fund data trimmed by removing funds in the 2.5% return tails. Analysis is based on the remaining 95% of funds, capturing approximately 2 standard deviations from the median, assuming a normal distribution of fund returns. The charts are composed of the VIX Index and dispersion measure represented by the difference between the 25th percentile and 75th percentile funds’ returns at each observation point. HFR, Constituents of the HFRI Composite measured by rate of return (%) since the first month of sufficient fund data to meet the trimming methodology outlined, March 1993. Bloomberg, Volatility represented by the VIX index, since March 1993, as of October 2022.
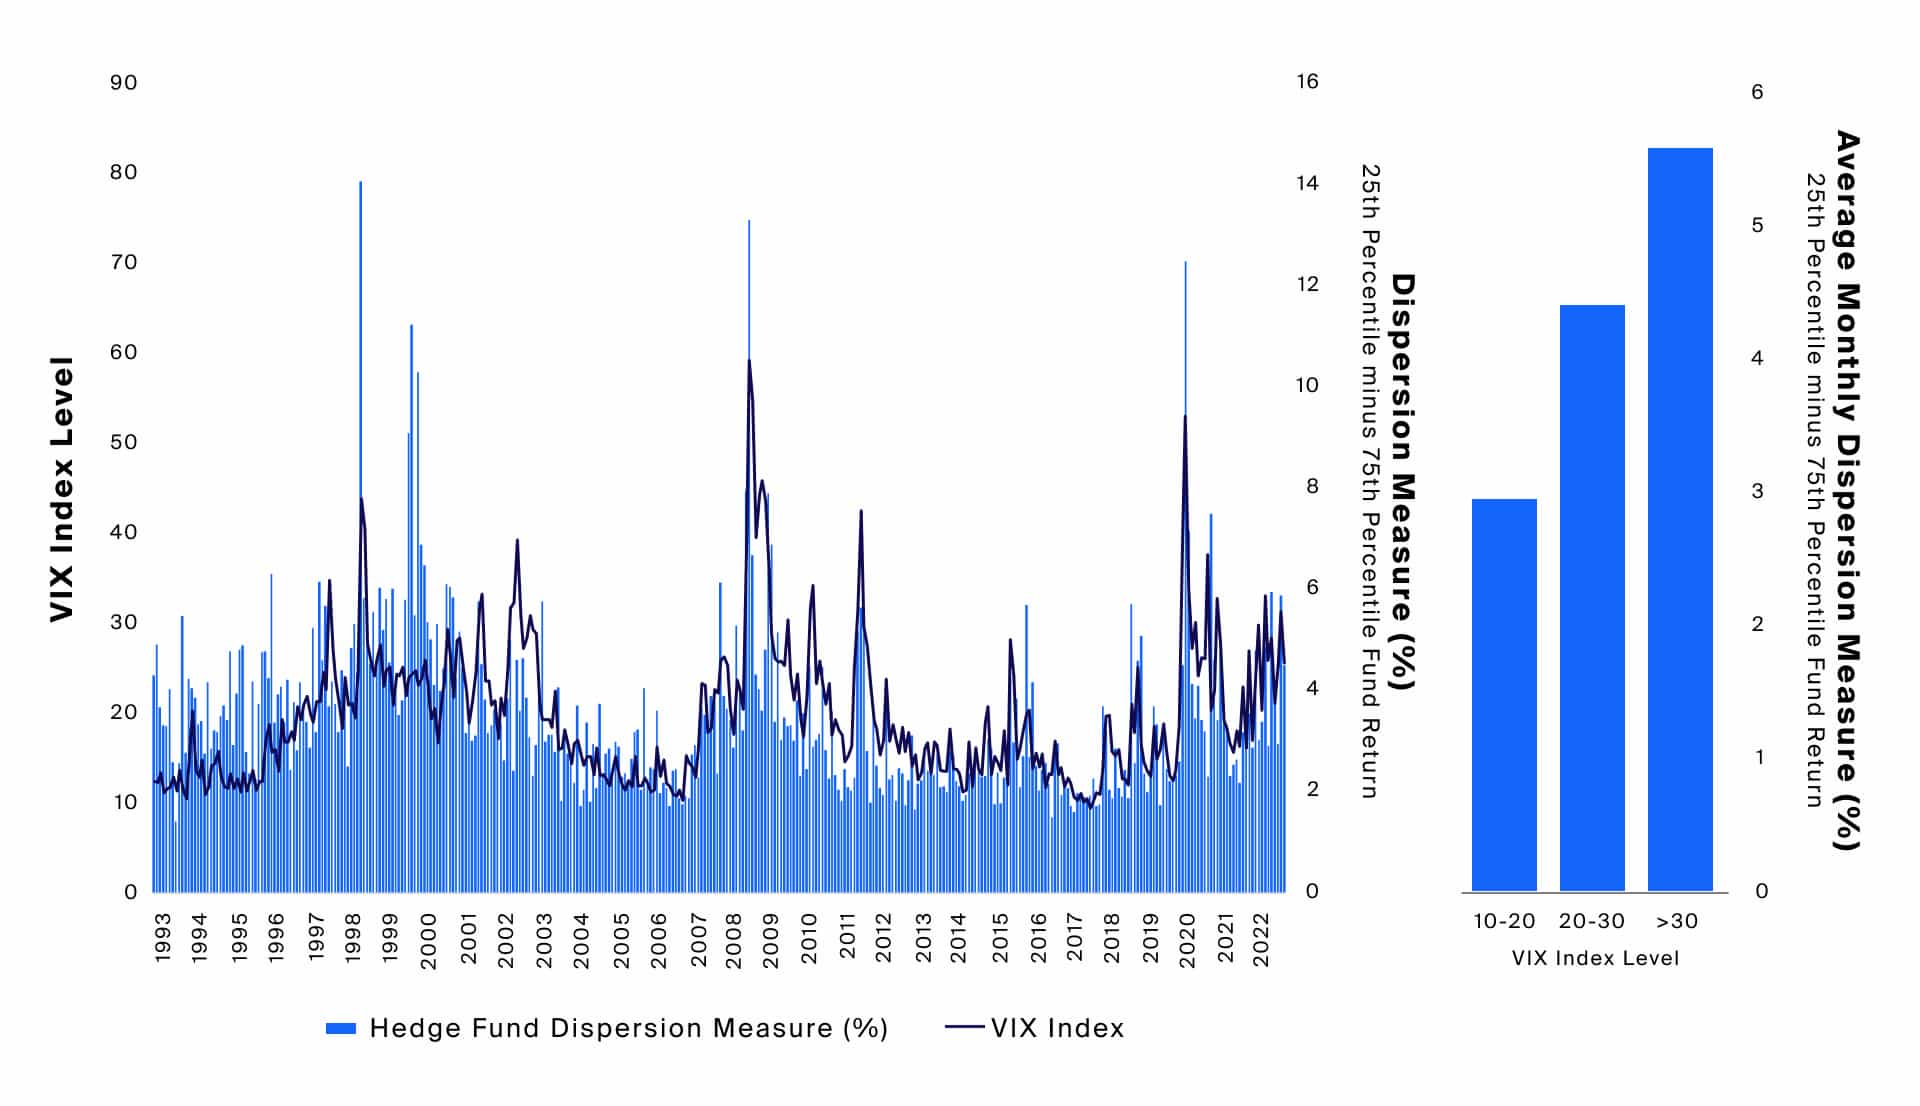
Manager dispersion may vary over time—performance outcomes for hedge funds widened in higher volatility market environments.
The historical dispersion of performance across hedge funds has been lower than other alternative asset classes. (Exhibit 2). Over time, however, that dispersion seemed to vary more dramatically.
Monthly performance dispersion between funds at the 25th percentile and 75th percentile spiked as high as 13.5% in the Global Financial Crisis and 12.6% in the immediate aftermath of the COVID-19 pandemic. In months where public market volatility was higher—marked by a VIX over 30—investors in funds at the 75th percentile experienced an average monthly return of 5.5% lower than investors in funds at the 25th percentile. Comparatively, in lower public market volatility environments where the VIX was between 10-20, the dispersion between these quartiles was 2.9% (Exhibit 3).
The high public market volatility environment that has persisted since the start of the year may continue given rising geopolitical tensions, persistently high inflation, uncertainty around monetary policy and the increasing likelihood of a recession.4 As a result, our analysis suggests that hedge fund performance dispersion—and perhaps the dispersion of other alternative asset classes—may be on the rise as well.
Past Performance Does Not Guarantee Future Results
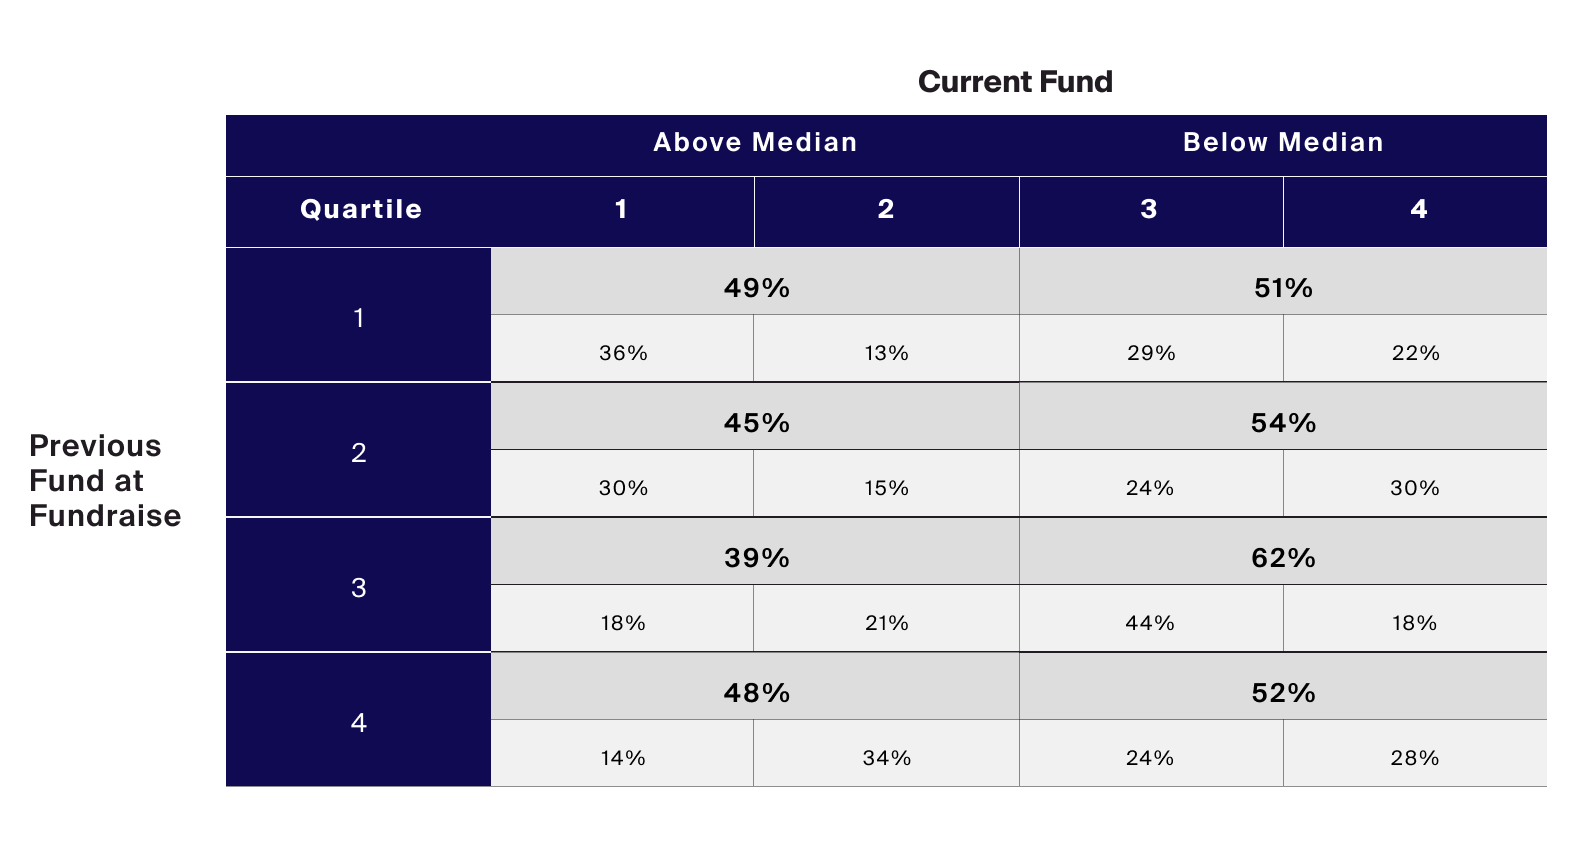
Having outlined the importance of manager selection when implementing alternatives in portfolios, financial advisors conducting due diligence may be inclined to turn to past performance as a measure of manager quality. Yet, while certainly an important element of a diligence process, past performance measures do not appear to be sufficient for increasing the likelihood of beating the median (Exhibit 4).
Source: Persistency in Alternative Asset Strategies: Private Equity Funds of Funds; Values represent North America-focused private equity funds of funds from 2009-2018.
Past performance isn’t necessarily indicative of future returns—funds in the top quartile were not more likely to perform above the median in the subsequent fund.
A study by Preqin on the persistence of performance among private equity fund of funds reveals that while top-quartile funds were more often followed by another top-quartile fund than each of the other quartiles (36%), their performances were distributed evenly above and below the median, at 49% and 51%, respectively.
And while few (14%) funds that follow a bottom-quartile performer end up in the top quartile, they often show improvement, with the subsequent fund performing more often in the second quartile (35%) than in each of the other quartiles. Like those following top-quartile performers, the funds that followed bottom-quartile performers were split roughly evenly above and below the median, 48% and 52% respectively (Exhibit 4).
In other words, investing in a fund that followed a bottom-quartile performer would have roughly equal odds of beating the median as investing in a fund that followed a top-quartile performer.
Therefore, thorough diligence can be very valuable for those interested in adding alternative investment allocations. To seek to mitigate manager selection risk in particular, financial advisors may consider engaging with independent, third-party due diligence experts to assist in their research efforts. Additionally, they may attempt to diversify across managers and funds over time to limit exposure to a single manager or fund.
Additional Risks and Considerations
Manager selection risk is only one of many risks that advisors may be exposed to when allocating portions of their portfolios to alternative asset classes. Beyond the wider performance dispersion of alternative funds compared to traditional funds, alternative asset funds also typically have lower liquidity both for the fund itself and in relation to the underlying asset. Alternative fund managers may also employ tactics that are inherently riskier than those available to traditional fund managers, such as greater use of leverage or shorting certain securities.
As we mention previously, the performance metrics in our analysis also differed across publicly traded securities, hedge funds, and private markets funds.
Public equity and fixed income fund returns are based on total annualized return of 2,389 funds over the past 10 years based on Bloomberg data. Hedge fund returns are based on the rate of return since inception of the 1,099 current HFR Hedge Fund Weighted Composite constituents, subject to survivorship bias. Finally, private markets returns are based on the latest IRR of 7,589 funds available through Preqin, limited to those that are deemed to have reached maturity.


